01. Overview
Project Goal
I designed a speculative **Command Center** — an integrated operations management platform for Canadian aquaculture farms. The goal is to streamline daily workflows through real-time monitoring, early anomaly detection, and precision feeding support.
Background & Motivation
Drawing from Japan’s advanced aquaculture practices and my university research experience, I wanted to contribute to Canada’s growing salmon farming industry by creating a more intuitive and practical tool for site operators.
Industry Context & Expected Impact
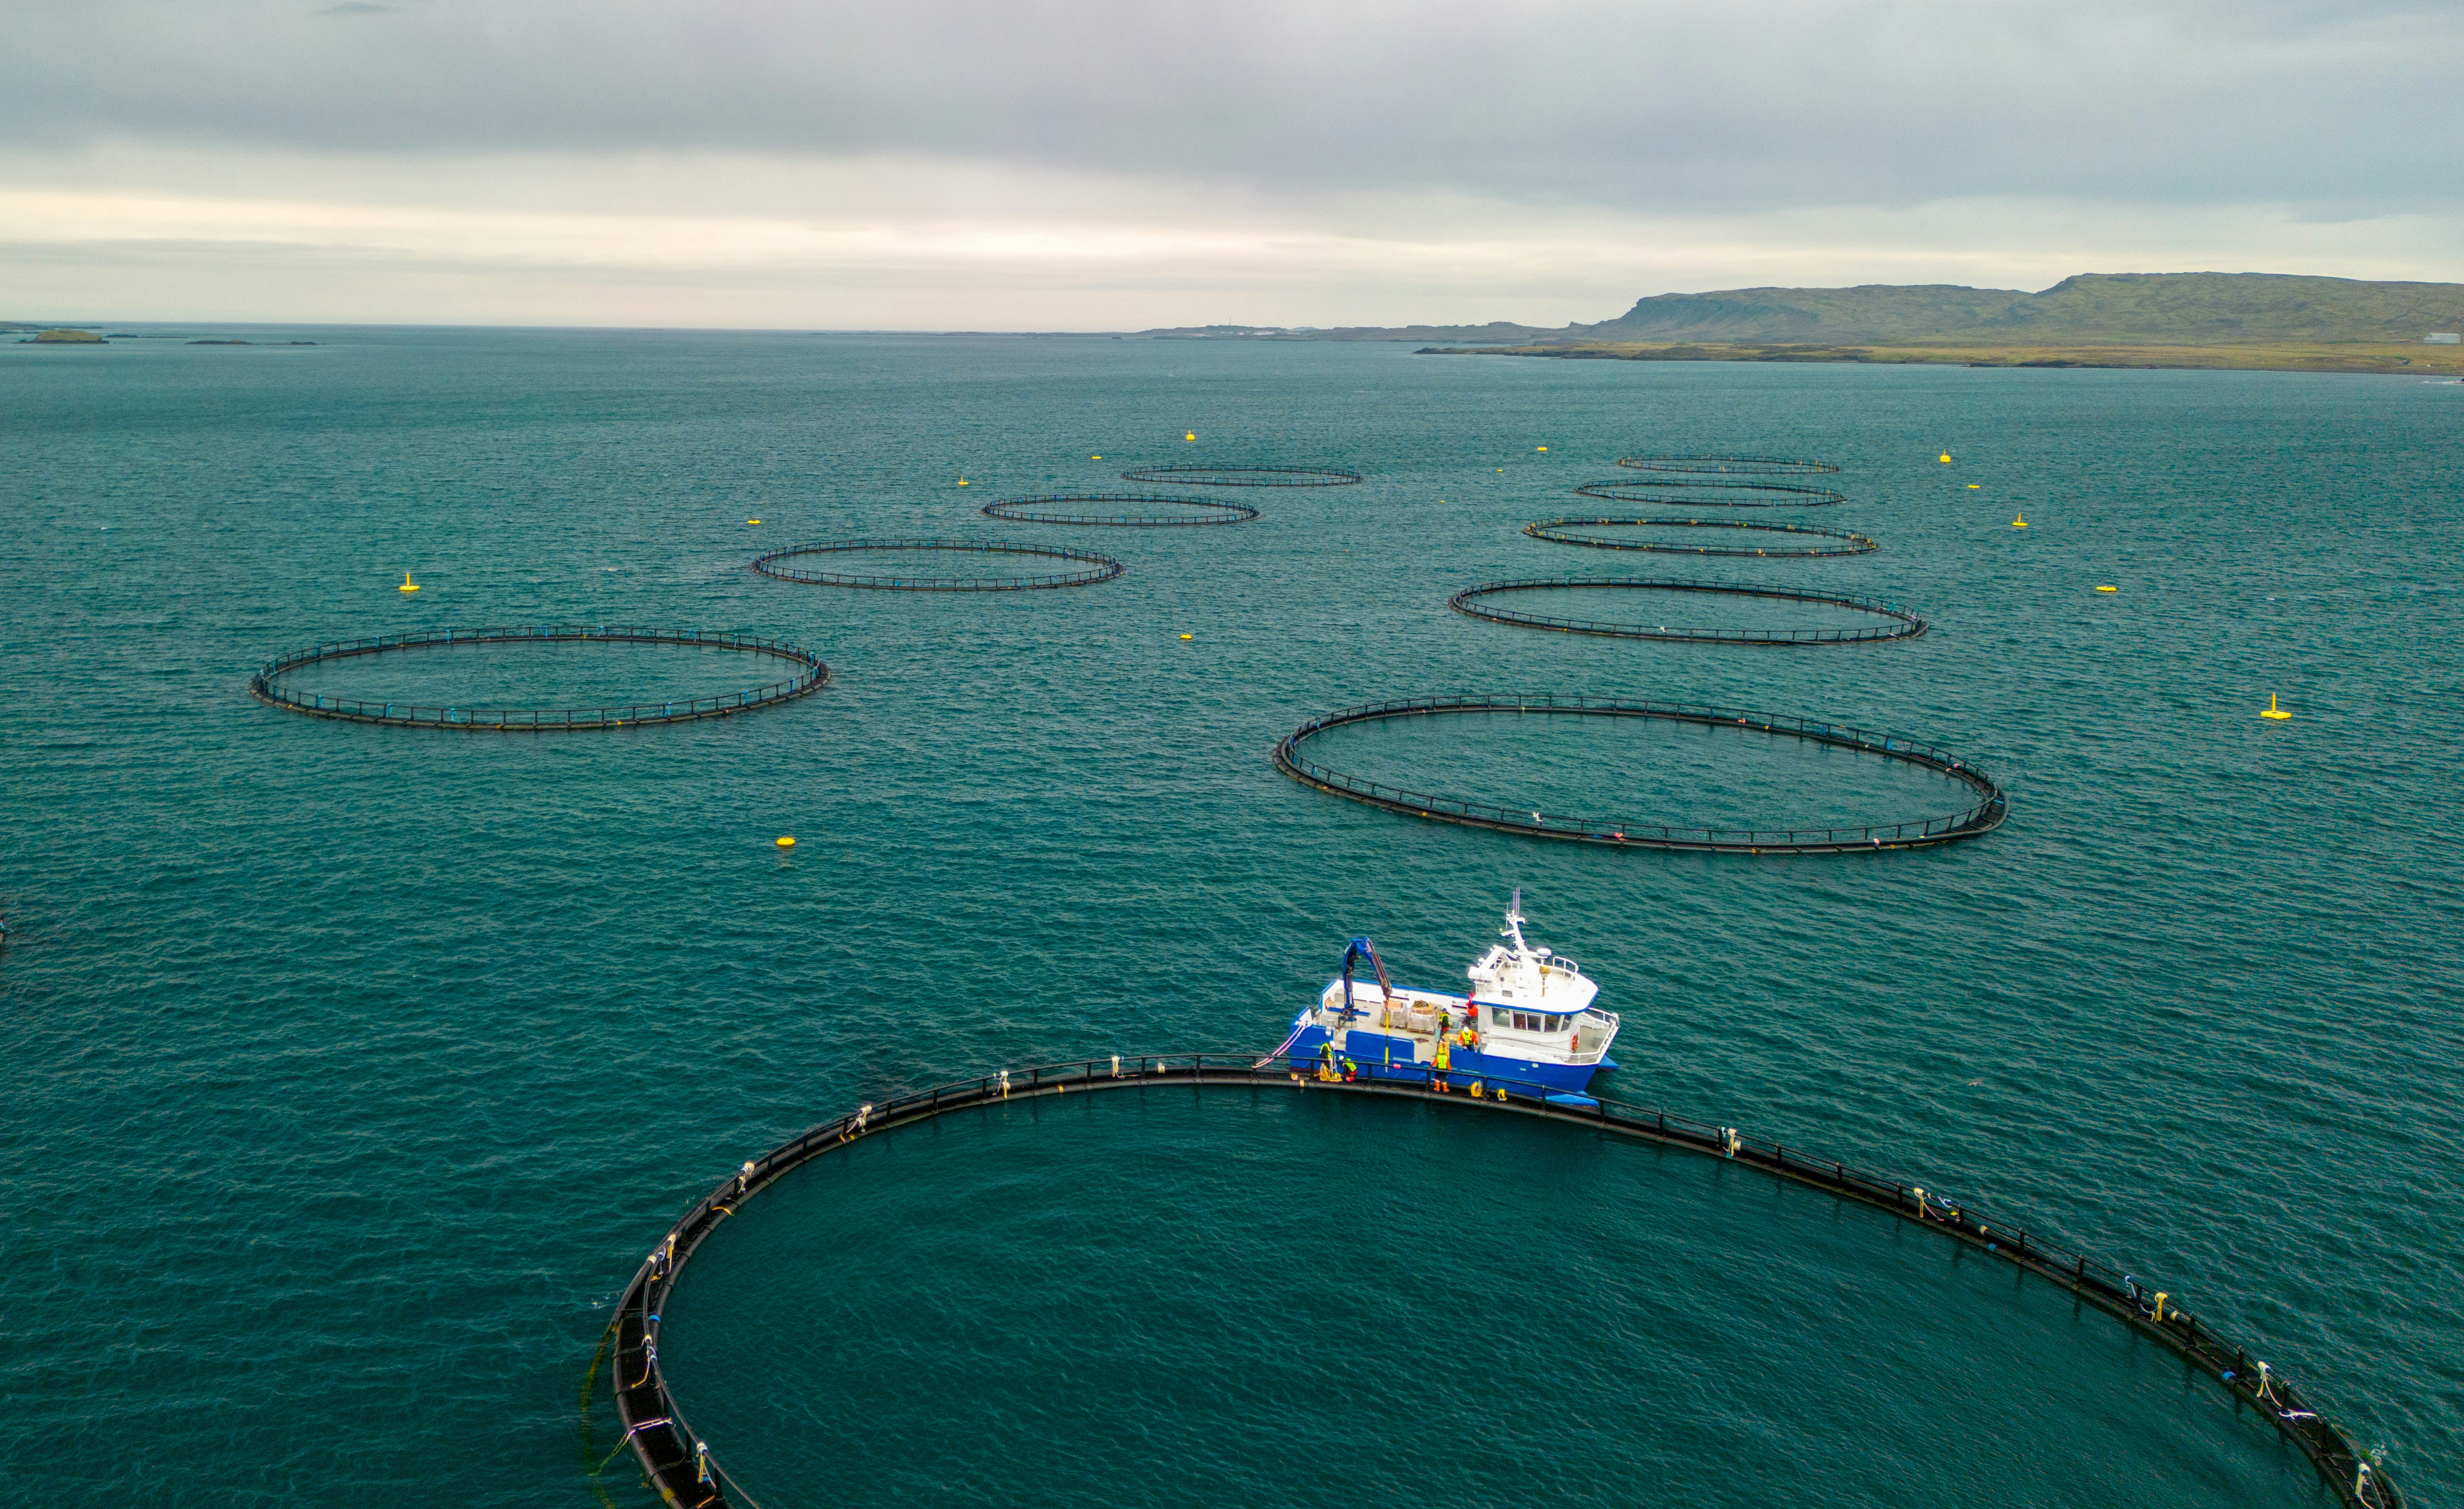
In Canadian aquaculture, feed accounts for 50–60% of operating costs. Even modest improvements in Feed Conversion Ratio (FCR) through better monitoring and decision-making tools can deliver significant savings — often hundreds of thousands to millions of CAD annually for large-scale operations.
This Command Center builds on existing platforms by enhancing **Pond Monitoring**, adding a **What-if Simulator**, and reducing cognitive load for both experienced managers and new staff.
02. User Personas

Persona A: Alex Rivera (45)
Experienced Farm Manager
"I need a single source of truth to bridge the gap between data-driven decision-making and operational reality."
Background
15+ years of experience in aquaculture, overseeing multiple net-pen sites. Values data-driven insights but struggles with extreme information fragmentation across legacy systems and records.
Pain Points
- Spends 1–2 hours daily on manual data consolidation.
- Delayed response times to early signs of disease or oxygen drops.
- Lack of standardized decision-making criteria for FCR optimization.

Persona B: Jordan Lee (24)
New Staff Member
"I want to feel confident in my daily observations, but I struggle to grasp the industry's unwritten practices."
Background
Technician with 6 months tenure. Formally trained but lacks the practical intuition to handle complex, emergency situations independently.
Pain Points
- Unclear task prioritization leads to frequent mistakes and oversights.
- Lacks confidence in assessing abnormal fish behavior.
- Cumbersome data entry creates high risk of input errors and time-consuming corrections.
03. Sitemap & Information Architecture
I designed the information architecture to support a logical daily workflow. The sidebar navigation follows the operational sequence: **Anomaly Detection → Root Cause Analysis → Countermeasures**.
I specifically included "Cage & Pond Status" and "Macro-Environmental Forecasting." The strategic intent behind this was to transform the dashboard into a "command center"—allowing operators to run the business rapidly and accurately, rather than wasting valuable time on manual data analysis. If field staff spend too much time deciphering data while environmental conditions deteriorate, the company faces risks of low yield or financial loss.
Designed Homepage User Flow
Sidebar Navigation Strategy
The sidebar is strategically structured to minimize the user’s cognitive load, following a logical operational workflow:
By fixing this specific workflow on the left sidebar, administrators can navigate the system seamlessly without confusion, maintaining the overall health of the farm through a consistent and intuitive logical framework.
04. Solution Strategy
The proposed Command Center platform is strategically designed to address the specific needs of both experienced managers and new staff members, creating a unified operational environment.
| User Type | Pain Point | Proposed Solution | Expected Benefit |
|---|---|---|---|
| Experienced Manager (Alex Rivera) |
Scattered information, requiring significant time to grasp the overall status of the farm. | Integrated Dashboard + Real-time Pond Monitor + What-if Simulator | Reduces situational awareness time by over 50%, enabling rapid decision-making. |
| Experienced Manager (Alex Rivera) |
Delayed detection of anomalies, leading to reactive rather than proactive responses. | Proactive Risk Mitigation Alerts + Status Badges + Trend Analysis | Minimizes the risk of mass mortality and prevents FCR deterioration before it happens. |
| Experienced Manager (Alex Rivera) |
FCR optimization relies heavily on intuition, resulting in low reproducibility. | Data Integration + Smart Feeding Recommendations + Simulator-based Projections | Expected 5-15% improvement in FCR, significantly reducing feed costs. |
| New Staff Member (Jordan Lee) |
Vague judgment criteria, leading to high anxiety and frequent operational errors. | Cognitive Load Reduction Design + Clear Status Indicators + Guided Workflow | Shortens training periods and reduces operational errors by 30%. |
| New Staff Member (Jordan Lee) |
Cumbersome data logging processes, resulting in frequent data-entry mistakes. | One-click Logging + Mobile Responsiveness + Automatic Synchronization | Cuts logging time in half and improves overall data quality. |
05. Main Dashboard
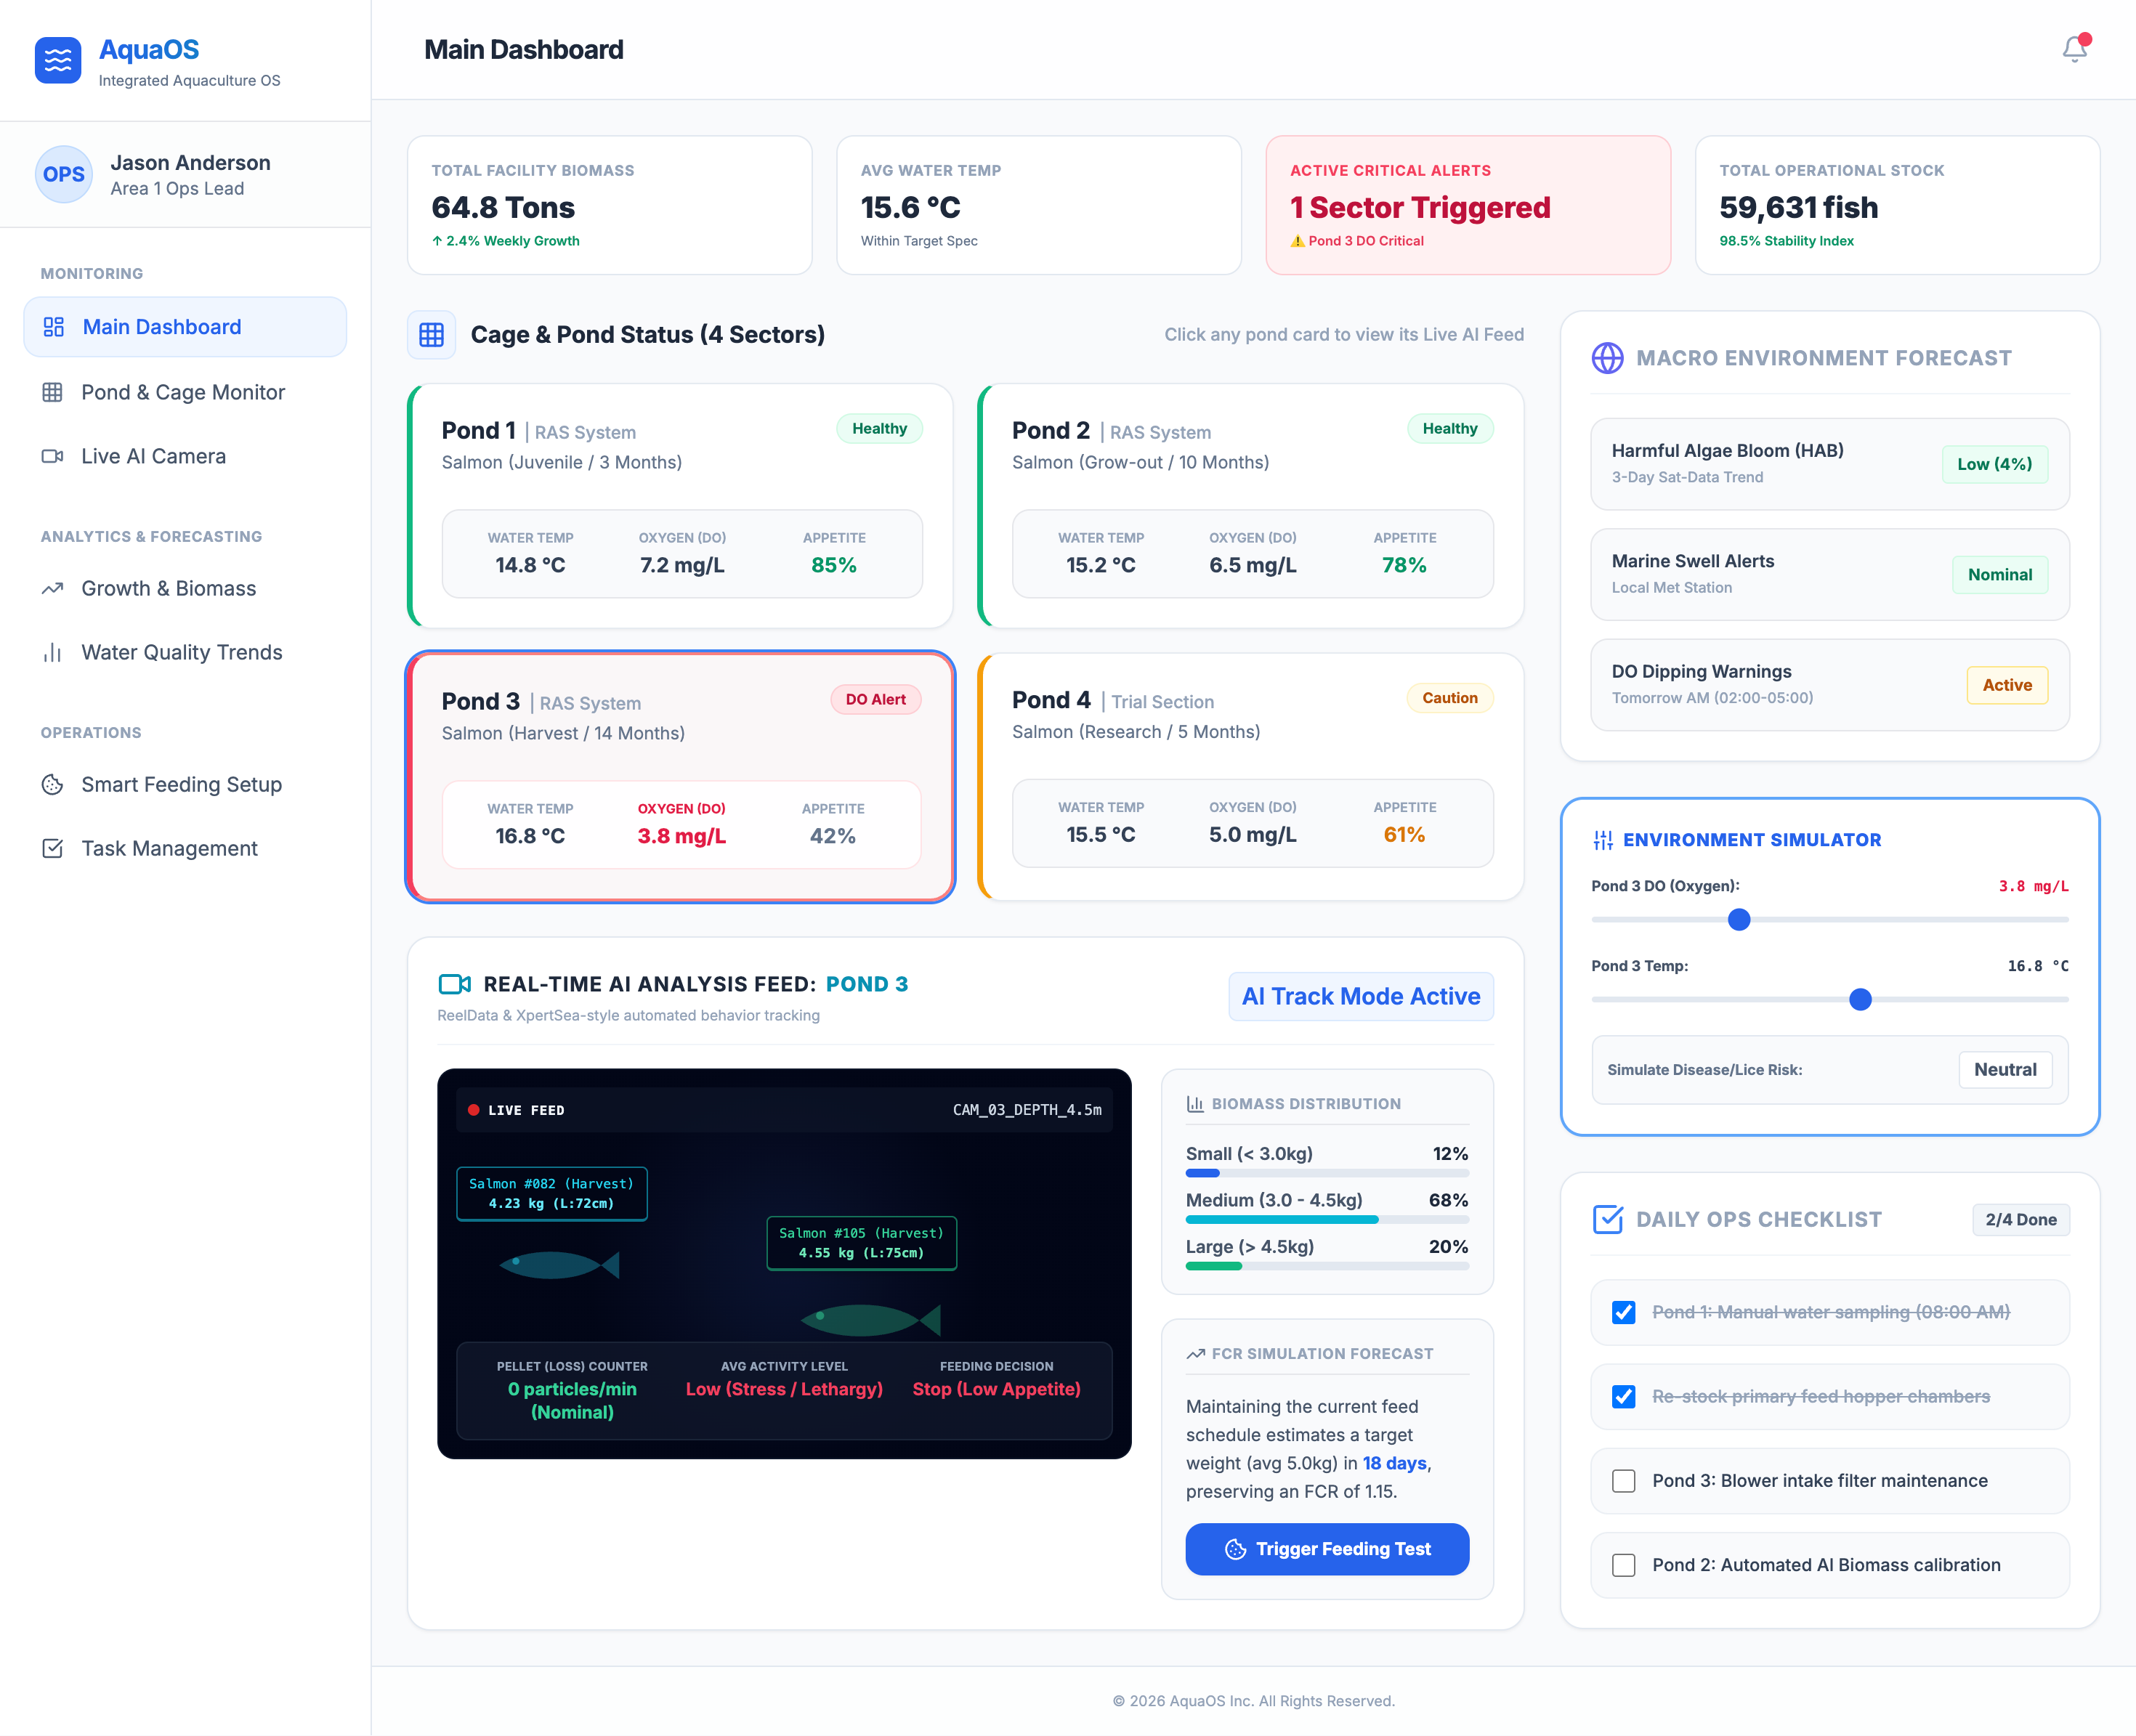
Main Dashboard - Interactive Prototype
You can click and interact with the prototype (desktop view recommended)
Aquaculture operators must constantly monitor water quality, fish health, feeding conditions, and environmental risks across multiple ponds or cages. However, critical information is often scattered across different systems, making it difficult to detect issues early and respond quickly. To address this challenge, I designed above idea, an integrated operations dashboard that brings real-time monitoring, AI-assisted analysis, and environmental forecasting into a single interface. The goal was to help operators move from reactive decision-making to proactive farm management.
The dashboard provides an at-a-glance overview of facility performance, highlights critical alerts, and allows users to drill down into individual ponds. By combining live sensor data, AI-powered fish behavior analysis, environmental forecasts, and operational task management, my idea enables faster decisions, reduces operational risk, and helps improve overall production efficiency.
06. Pond & Cage Monitor
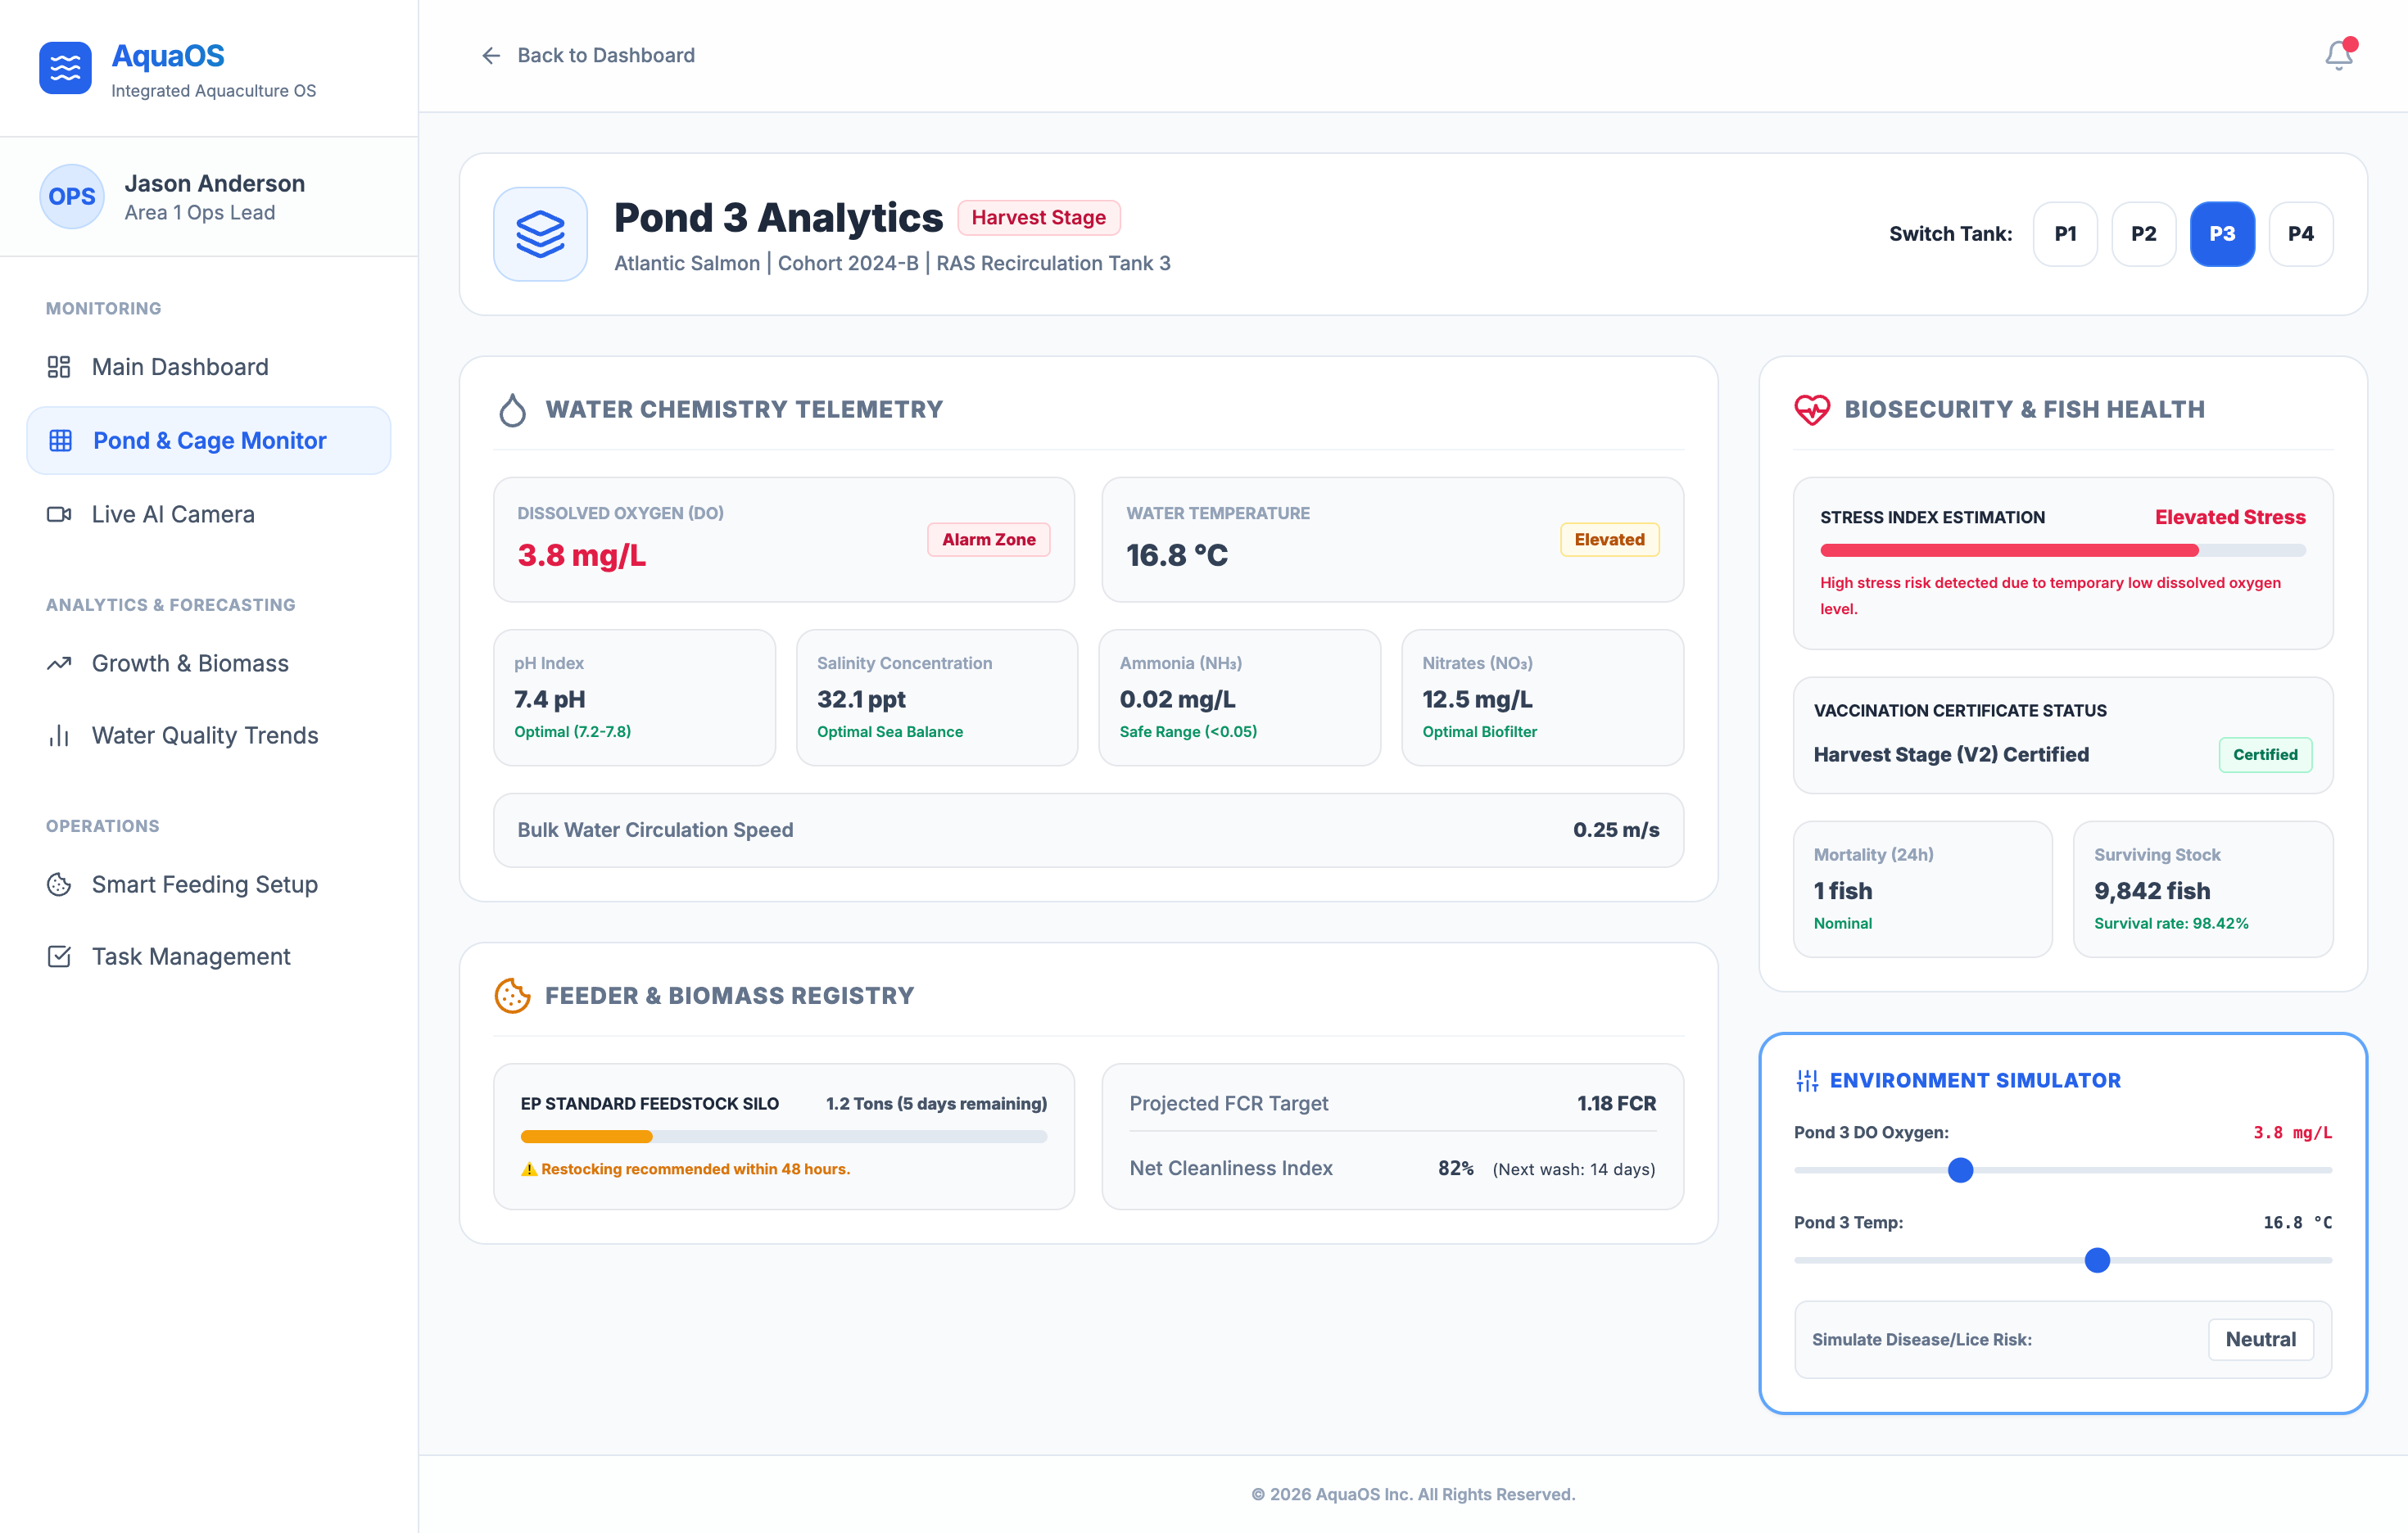
The Pond & Cage Monitor is built around four strategic pillars to support proactive and efficient farm operations.
Proactive Risk Mitigation
Strategic Intent
Shifting from reactive firefighting to early warning alerts (Elevated Zones) via trend analysis.
Expected Outcome
Operators can adjust aerators or restrict feeding proactively, preventing disease outbreaks and mass mortality.
Standardization of Knowledge
Strategic Intent
Digitizing the "gut feelings" and intuition of experienced farmers into measurable data metrics.
Expected Outcome
Establishes a "common language" within the organization, ensuring stable performance regardless of experience level.
Maximizing Efficiency
Strategic Intent
Integrating the Feed Conversion Ratio (FCR)—the largest cost driver—with real-time water quality data.
Expected Outcome
Eliminates feed waste and maximizes Return on Investment (ROI).
Cognitive Load Reduction
Strategic Intent
Supporting critical decision-making through a built-in "What-if" simulator.
Expected Outcome
Empowers operators to make calm, evidence-based decisions even during high-pressure anomalies.
Based on these strategic pillars, I integrated these specific features into the Pond & Cage Monitor interface.
07. Validation of Design Effectiveness
To ensure the practicality and usability of this dashboard, I conducted focused validation within the available time constraints. I concentrated on the most critical user flow—responding to an anomaly—and created two high-fidelity mockups: “Main Dashboard” and another dashboard page, Pond 3 Analytics (Detailed Analysis Screen)
- 01. Main Dashboard (Top Page)
- 02. Pond 3 Analytics (Detailed Analysis Screen)
01. Main Dashboard (Top Page)
02. Pond 3 Analytics (Detailed Analysis)
Key Validation Points
- Whether the Dissolved Oxygen (DO) drop alert for Pond 3 is visually noticeable immediately on the top page.
- Whether the highlighted red frame and Critical Alert naturally guide users to navigate to the Pond 3 Analytics screen.
- Whether key information—Water Chemistry Telemetry, Stress Index Estimation, Feeder & Biomass Registry, and Environment Simulator—is easy to understand at a glance, enabling quick decision-making.
Testing Results
I also carried out simple walkthrough tests with non-specialists to verify that the entire process—“Anomaly Detection → Situation Understanding → Next Action”—can be completed smoothly within 30 seconds. Through this validation, I confirmed that the dashboard provides sufficient immediacy and clarity required for real-world use by site operators.
08. Expected Outcomes
Expected Business Impact
Based on industry benchmarks from real-time monitoring and precision aquaculture platforms, this Command Center is expected to deliver meaningful operational improvements. For example, similar systems have demonstrated anomaly detection time reductions of up to 50%, enabling faster responses to critical events such as low dissolved oxygen or disease indicators.
By implementing the Pond Monitor with proactive alerts and trend analysis, the design aims to reduce the risk of mass mortality events through early intervention — potentially helping maintain higher survival rates and stabilizing production output. Additionally, the integration of the What-if Simulator and optimized feeding recommendations is projected to support FCR improvements of 5–15%, which could translate into feed cost savings of 10–20% depending on farm scale and current baseline performance.
In large-scale Canadian aquaculture operations, even modest FCR gains (e.g., 0.1 point improvement)can result in annual feed cost reductions ranging from hundreds of thousands to several million CAD. This proposal seeks to contribute to these outcomes by combining existing monitoring capabilities with a more integrated, user-friendly interface tailored to daily farm workflows.
Anticipated Benefits of Key Features
Pond Monitor & Proactive Alerts
Real-time integration of water quality, fish behavior, and environmental data is expected to significantly shorten the time from anomaly detection to action. Industry cases of similar IoT-enabled monitoring systems show potential reductions in response time by 40–60%, which can help mitigate mass mortality risks and support more consistent production yields.
Overall Efficiency Gains
The unified Command Center design, with cognitive load reduction principles, is projected to reduce daily administrative and data-handling time. Comparable farm management platforms have reported up to 60% reduction in data entry and reporting time, freeing staff to focus on higher-value tasks.
These expected outcomes are based on publicly available industry reports and benchmarks from precision aquaculture tools. In a real deployment, I would work closely with farm teams to measure and validate actual results through iterative testing.